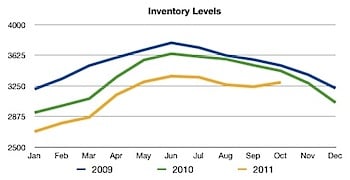
Last week I posted on lockbox openings. This week I take that data one step further and overlay those trendlines on the inventory trendlines for nearly three years of info. Quick recap on inventory: below are the inventory trends for the MLS since 1/1/2009. They are the actual number of active listings on the 1st day of each month for the period. They include listings in the 16 primary counties / cities that are in the CAAR area. (Albemarle, Amherst, Augusta, Buckingham, Charlottesville, Culpepper, Fauquier, Fluvanna, Goochland, Greene, Louisa, Madison, Nelson, Orange, Rockbridge, and Waynesboro.)
 Then, we distilled the info on lockbox openings from last week into monthly data instead of weekly. Herein lies the first issue. The information I have on lockboxes is not in monthly data, it is in weekly. I have broken the data into the monthly brackets. However, four of the months had five weeks in them, and the rest four. To smooth that curve and make it make sense (all months could have 28 days instead of some having 35) for the months with five weeks, I summed the data for lockbox openings and divided by five and multiplied by four. It’s not precise, but it is pretty darn close.
I then took the two charts and divided the showings by the listings and got the information shown in the chart below.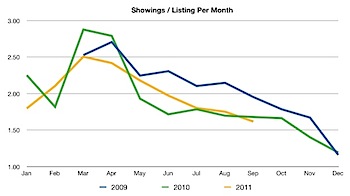
A few things I noticed. As one would expect, showings drop off significantly as each year progresses. What surprised me though was how short a peak there is each year. By the time May and June roll around, while they may be more showings, the number of active listings is up so much that the positive impact of the added showings is overshadowed by the inventory. There appears to be only a 60 day period during which sellers have the opportunity to take advantage of the spring shoppers before other sellers enter the market. Note that in 2010 this is exaggerated by the Homebuyer Tax Credit. Otherwise, 2011 showings seem to be down between 15 and 20% from peak based on inventory.
Some additional notes on limitations. For Inventory numbers, I used a 16 county list. For many of these areas (Waynesboro for instance) the town lies on the cusp of two Realtor Associations. Waynesboro uses a different lockbox system; however, many agents still list with CAAR. My response to this limitation is that while there is a contribution to an guaranteed error, that limitation runs through all the numbers evenly. We are not interested in the specific number of showings, but rather the ratio over time and the trends. Having some listings that are not on our lockbox system does not change those trends.
Another issue revolves around Bank Owned Properties or REOs. When banks list property, many times these properties are not on association lockboxes. Instead, there are combo-locks that the bank can use with their own contractors. If the foreclosed homes are the listings that are getting the most attention, and those showings are not being tracked, there is question as to how much impact this is having. As of today, there are 3013 listings in the 16 counties listed above. There are 129 total properties that are Bank Owned. Even if REOs are getting double the number of showings and not one REO has an Association Lockbox, this still means less than a 5% impact on total showings.
———-
Keith Davis is a Partner and Associate Broker with Nest Realty Group.