A few months ago, we took a closer look at inventory levels for homes throughout Charlottesville and Albemarle County. Since I’m a big believer that inventory levels are a predictor of future real estate values, I’d like to take another look…this time for single family and attached homes in Albemarle County.
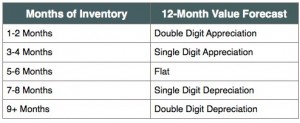
As you may recall, Steve Harney introduced this chart to me – it relates current inventory levels to a 12-month forecast in real estate values:
Is this theory exact? No. But it makes sense. It’s basic supply and demand.
So, what exactly do I mean when I refer to ‘inventory levels’? Well, here’s the quick description: inventory level is basically the supply of homes at specific date divided by the sales during a month. For example, if there are 600 homes on the market right now and there have been 50 sales in the most recent month, there is a 12 month supply of homes (600/50). In this example, if not one new home was listed for sale over the upcoming year, there would (theoretically) be no inventory of homes left after 12 months.
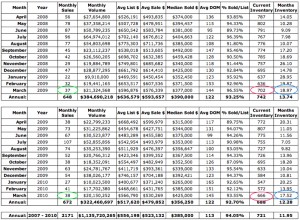
So check out these inventory levels for single family detached Albemarle County homes:
While the numbers aren’t pretty for March 2010 (17.52 months of inventory…that’s a lot), it does show that things are improving ever so slightly since March 2009 had almost 19 months of inventory. But I think that looking on a monthly basis is a bit deceiving since there were only 38 sales – that sample size just isn’t big enough to deduct the truth from.
I like to look at 12 month periods. The last 12 months are showing some improvement from the 12 month period before that. Inventory levels are down (13.74 to 12.28). Sales are up (672 to 648). Days on Market are steady at 122. But median price is down from $390,000 to $356,250. This median price drop is actually a good thing and shows that our market is correcting (something that has to be done to get back to a ‘normal’ market).
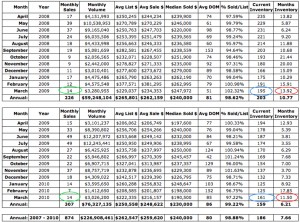
And now Attached Albemarle County homes…
These numbers are actually improving significantly. While the list-to-sale price ratios may be skewed by new home sales (sorry, Sellers, homes aren’t really selling for 99% of list price), the overall stats are actually pretty darn positive. Inventory levels for the previous 12 months are hovering just about 6 months – that is the definition for a ‘balanced market.’ Sales are up very dramatically (307 vs. 226) and median prices are down from $240k to $230k.
Are attached homes rebounding before single family homes in Albemarle County? This would definitely be odd, but it looks to be the case.
We’ll keep our eyes on this and will let you know how things transpire as the Spring market continues…


rfs
Written on
Jonathan,
Can you help me understand this…
“While the list-to-sale price ratios may be skewed by new home sales (sorry, Sellers, homes aren’t really selling for 99% of list price), the overall stats are actually pretty darn positive. Inventory levels for the previous 12 months are hovering just about 6 months – that is the definition for a ‘balanced market”.
If there are 11-12 months of inventory on these graphs, how is it hovering at 6 months – meaning a balanced market? It seems new inventory is being added all the time, well outpacing sales. Please know this is not meant to be argumentative or combative, I just want to understand the logic. Perhaps I am missing something?
Jonathan Kauffmann
Written on
rfs-
You’re right – the current inventory levels for March of 2010 are at 11.50 months. However, if you look at the previous 12 months (April 2009 – March 2010), there have been an average of 6.21 months of inventory (over that time period).
According to Steve Harney’s chart/theory, this constitutes a balanced market for attached homes in Albemarle….if you look at that more extended time period.
However, while things are improving (see the stats), it doesn’t quite feel like a true balanced market out there. I do admit that.
I would say this, though: you are absolutely correct that new inventory is outpacing sales right now…probably in all categories. Specifically, February and March are very popular months to list properties, but not much sells in those months. Therefore, it makes sense to look at a longer term (not just one month) when analyzing median price, days on market, inventory levels, and any other statistic.
I think the overall point here – and I’ve touched on this in a few posts recently – is that for the first time in two years we are actually seeing ‘mixed’ signals instead of only negative/downward signs.
Let me know if this makes sense and what your thoughts are.
Humpster
Written on
What you fail to account for in your “mixed signals” analysis is the rate of actual home sales are being fictitiously propped by the $8,000.00 tax incentive and cheap mortgage rates. The latter is not going to last long and I’m not sure about the tax incentive, it will probably be renewed because that’s what government does really well (handing out OPM). My point is that you are seeing these mixed signals because of government intervention. Sooner or later the sellers will capitulate. Until then the problem will only fester.
Jonathan Kauffmann
Written on
Humpster-
I agree that the $8k tax incentive has helped to boost sales some. But it was there last year also and we didn’t see much (if any) positive trending in the market.
The increase in sales in Central Virginia (and in probably every other market in the country) is more tied to the drop in prices than the tax credit.
But I think we both are on the same page with this belief: the market cannot begin to truly correct until the government stops propping it up.
rfs
Written on
Thanks, Jonathan.
I see the logic, and I will admit that I do see many “sale pending” or “under contract” signs in the area. I also think the next 5 months (April to August) will be very telling. Price drops will move inventory, but bank owned properties, folks that must move for whatever reason will certainly keep supply way higher than demand. Agree on the tax credit. That probably sped up sales for first timers which in turn may have affected the attached housing sales boost. But alas the tax credit is done in a few weeks. Move up buyers unfortunately have their own houses to sell…
Jonathan Kauffmann
Written on
rfs-
Stay tuned in the next week for our 1st Quarter ‘Nest Report’ – we’re going to shed some light on a few other trends.
You’re right about the ‘under contract’ signs in the area. Here’s another example that there is some action in the market: I’ve talked with 2 home inspectors in the last few days that are booked 2 weeks out. That’s a good sign for the market, in general, and definitely busier than it was at this point last year.
However, it will definitely be interesting to see what transpires after April 30th (tax credit deadline) and August 1st (typically when showings start to slow in our region).